Use interest rate term structures for calculations is one of the daily activies that any quant has to accomplish with. I use the many of the curves released by BM&F Bovespa in that page. In order to have the curves always at hand I've written that few lines of code to download and return an interpolator where the only argument is the number of days I want to interpolate.
library(XML)
library(bizdays)

cal <- create.calendar(name='ANBIMA', holidays=holidaysANBIMA, weekdays=c('saturday', 'sunday'))
bizdays.options$set(default.calendar=cal)

.get_curve_url <- function(refdate, ticker) {
    url <- 'http://www2.bmf.com.br/pages/portal/bmfbovespa/boletim1/TxRef1.asp'
    query <- str_supplant('?Data={refdate}&Data1={sysdate}&slcTaxa={ticker}',
        list(refdate=format(as.Date(refdate), '%d/%m/%Y'),
            sysdate=format(Sys.Date(), '%Y%m%d'),
            ticker=ticker))
    paste0(url, query)
}

get_curve <- function (refdate, ticker='PRE') {
    refdate <- as.Date(refdate)
    url <- .get_curve_url(refdate, ticker)
    doc <- htmlTreeParse(url, useInternalNodes=TRUE)
    num <- xpathSApply(doc, "//td[contains(@class, 'tabelaConteudo')]",
        function(x) gsub('[\r\n \t]+', '', xmlValue(x)))
    num <- sapply(num, function(x) as.numeric(gsub(',', '.', x)), USE.NAMES=FALSE)

    colspan <- as.integer(xpathApply(doc, "//td[contains(@class, 'tabelaTitulo')]",  xmlAttrs )[[2]][3])
    if (colspan == 1) {
        terms <- num[c(TRUE, FALSE)]
        rates <- num[c(FALSE, TRUE)]/100
        log_pu <- log(1 + rates*terms/360)
        rate <- function(pu, term) (pu - 1)*(360/term)
    } else {
        terms <- bizdayse(refdate, num[c(TRUE, FALSE, FALSE)])
        rates <- num[c(FALSE, TRUE, FALSE)]/100
        log_pu <- log((1 + rates)^(terms/252))
        rate <- function(pu, term) pu^(252/term) - 1
    }

    log_price_interpolator <- approxfun(terms, log_pu, method='linear')
    function (term) {
        pu <- exp(log_price_interpolator(term))
        rate(pu, term)*100
    }
}
So, once you have loaded that code you can get the Brazilian interbank curve by calling:
irbrl <- get_curve('2013-06-13', 'PRE')
irbrl(seq(21, 252, by=21))
##  [1] 7.880000 8.010000 8.158363 8.369100 8.537173 8.655198 8.740000
##  [8] 8.826095 8.895053 8.965071 9.050000 9.121180
The curve for US dollar deposits in Brazil
irusd <- get_curve('2013-06-13', 'DOL')
irusd(seq(30, 360, by=30))
##  [1] 0.3135554 0.6300000 0.8300000 1.0400000 1.1381183 1.2000000 1.2400000
##  [8] 1.2699991 1.2900000 1.3200000 1.3400000 1.3592817
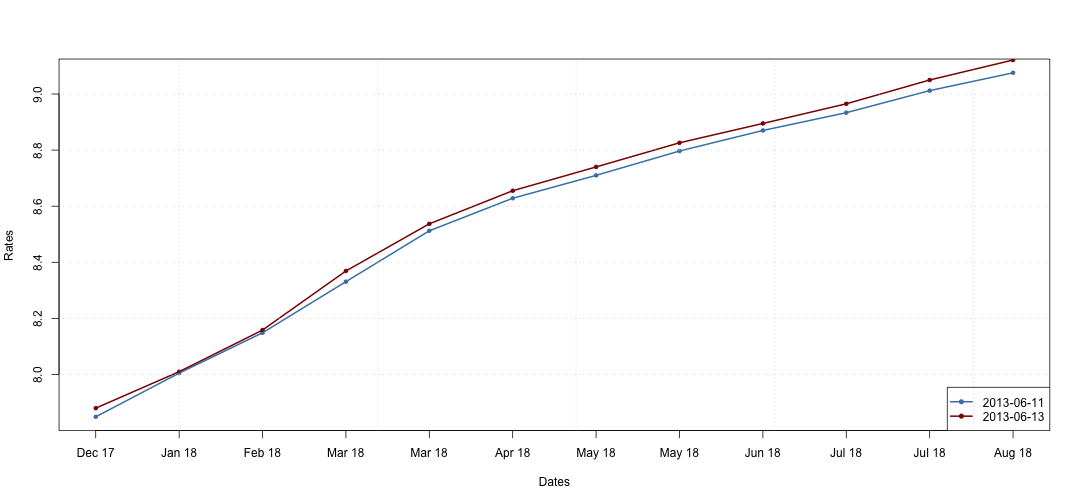
You could compare in the same chart curves of different dates
irbrl_20130613 <- get_curve('2013-06-13', 'PRE')
irbrl_20130611 <- get_curve('2013-06-11', 'PRE')
seq(21, 252, by=21) -> terms
irbrl_20130611(terms) -> d11
irbrl_20130613(terms) -> d13
terms <- terms + Sys.Date()
plot(terms, d11, type='n', xlab='Dates', ylab='Rates', xaxt="n")
axis(1, terms, format(terms, "%b %y"))
points(terms, d11, pch=20, col='steelblue')
points(terms, d13, pch=20, col='darkred')
lines(terms, d11, lwd=2, col='steelblue')
lines(terms, d13, lwd=2, col='darkred')
legend("bottomright", legend=c("2013-06-11", "2013-06-13"), col=c("steelblue", "darkred"), pch=20,lwd=2)
grid()
The function str_supplant was explained in another post.
I mostly use the tickers PRE for deposits in Brazilian Real and DOL for deposits in US Dollar.
That code works pretty well for EUR (Euro deposits) interest rates, but it has to be adjusted to handle DIC and DIM tickers (IPCA and IGP-M inflation rates).
As I told before that is a quick and dirt implementation but it is also quite useful. With far none effort you have at hand an interpolator for interest rate term structures that can easily be ported to any other curve feeder.
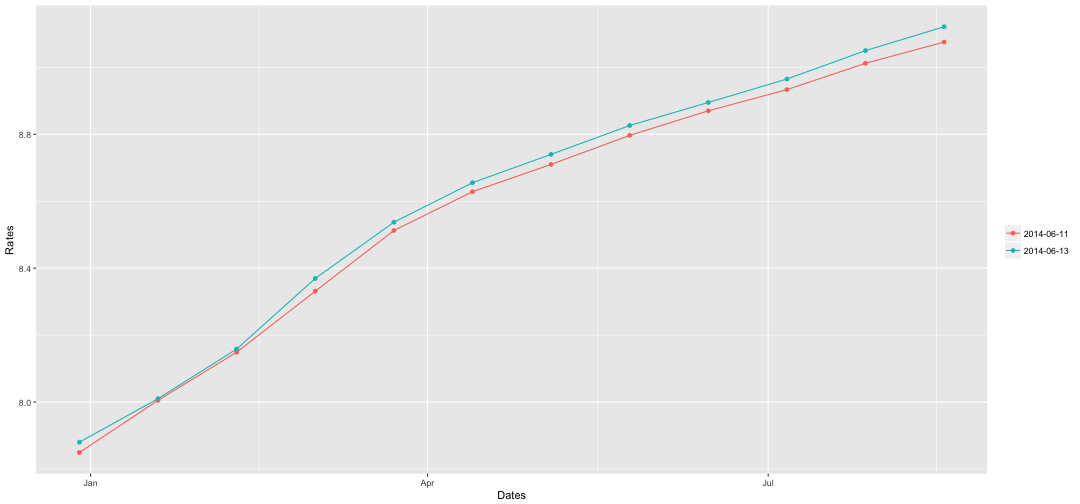
Other point I'd like to mention is the huge effort, in my opinion, to build a attractive chart using the plot function, bellow I present an example using the ggplot2 package for the same data.
library(ggplot2)
ir_df <- stack(list(`2014-06-11`=d11, `2014-06-13`=d13))
ir_df$date <- terms
ggplot(data=ir_df, aes(x=date, y=values, colour=ind)) + geom_point() + geom_line() + xlab('Dates') + ylab('Rates') + theme(legend.title=element_blank())